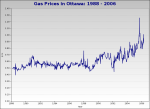
Gas Prices
 Now that gasoline is regularly over a dollar per litre, I decided it was a
good time to make an effort to do something useful with all that data I
collect at every purchase. Yes, every time I buy gas, it's recorded.
People these days complain a lot about rising fuel costs. The recurring question to me is whether or not the complaining is justified; perhaps the rate is increasing more-or-less with other prices?
The resulting graph is interesting. It shows that:
- Gas prices were fairly consistent throughout the nineties
- Prices actually dropped to 1988 levels in 1999 and 2002
- The variation in pricing used to be a couple of cents
- Since 2000, price variations are large and unpredictable
- The average increase since 2001 is more-or-less linear
I am not an economist, and I do not understand the "economic ecosystem" (my guess is that no one does), but it seems to me that if a chocolate bar that cost 50 cents in 1988 now costs a dollar, then it makes legitimate sense that gasoline would double in price as well.
Unfortunately, the average Canadian salary has not doubled. Perhaps this is why people feel the impact. Nevertheless, prices on many items have gone up significantly in the last eighteen years, so is it oil getting expensive, or oil catching up to the rest of society? Will the graph level off once again in the next year or so?
